Try also the other free BPI TIME STUDY Tools for measuring Process Time, Timesheet keeping, Reporting, etc. here:
TIME STUDY - BPI CLOUD COMPUTING TOOLS.


You may be interested in reading the introduction on Cloud computing
here: Cloud Computing.
here: Cloud Computing.
Currently Available FREE BPI Tools
- Activity Network Model Generator & Solver - A network of facilities (or departments, activities, etc.) to serve clients (e.g. in any services as financial/banking, consumer products and retail, public services, entertainment, etc.), products, orders (e.g. sales department, hr, procurement,...), etc. You can design and size (number of servers/employees, waiting time, etc.) your facilities/network with this tool!
- Decision Modeling Tools - Specialist Allocation Model Generator & Solver - This tool will calculate the optimal number of specialists that you need to send from each given location to the other locations, taking into account the available number of specialists and the required number of specialists per location!
- Statistical Process Control - This tool will automatically analyze your process data taking the sub-grouping of the data also into account. It will calculate all important statistical properties, it will automatically generate control charts and it will also automatically indicate on the control charts the most important problems with your process.
- Decision AI - This tool is an Artificial Intelligence (machine learning) decision making business process improvement tool which can be used (after training the AI) to quickly make decisions about many different often complex matters as e.g.
- Which next process step the employee (or client, product, etc.) has to take,
- Decide if an action should be taken or not,
- Select an employee (or client, product, etc.) for a specific task (or action, marketing campaign, etc.),
- Root cause analyses,
- ...etc. the applications are endless.
Last BPI Tools Version 16/Update: 05.02.2017
Use the Software feedback form to request new features or report problems:

This tool is available as a free Google Sheets Add-on and can be accessed from anywhere (in the cloud) from any device (PC, Mac, tablet (iOS, Android), smart phone, digital TV, etc.) with a web browser. The Add-on is optimized for the free Google Chrome web browser. IMPORTANT: On a tablet or mobile device, instead of using the Google Sheets App (does not support Add-ons yet!) use the Chrome web browser to start Google Sheets. After navigating to the Google Sheets website (https://sheets.google.com) click on the top right menu (3 dots) in Chrome and check the 'Request desktop site' check box!
You find detailed explanation of these tools here under.

How to start using these free Tools
- Start Google Sheets (push the blue Google Sheets button here under).
- Start a New Blank spreadsheet.
- Add the 'BPI Tools' add-on from the Add-on menu (available in the Google Web Store for free). Click the menu 'Add-ons', then click 'Get add-ons'. The Add-ons screen will appear. Use the search box on the top-right and search for 'BPI Tools'. There are two BPI Tools, select the one with only 'BPI Tools' in the title and add it with the + FREE button.
- When the Authorization Required dialog appears push 'Continue'.
- In the dialog 'BPI Tools would like to:' push the 'Allow' button. This is a standard procedure to authorize the Add-on to work with your current spreadsheet.
- Follow the instructions presented in the add-on sidebar and here under.
TIP: You can also use Google Sheets on your tablet! Instead of using the Google Sheets App use the Chrome web browser on your tablet to start Sheets. After navigating to the Google Sheets website (https://sheets.google.com) click on the top right menu (3 dots) in Chrome and check the 'Request desktop site' check box. In this way you will be able to use the full functionality of Google Sheets on your tablet!
")
Facility/Activity Network Model Generator & Solver
In many real life situations a customer (or product, order, etc.) has to go through a series of service facilities (or departments, activities, etc.), and thus also queues (waiting lines), which are arranged in a connected network.

Assumptions:
- Open network, which means that customers (or jobs or items) are arriving from an external population. Where external population means external to the processes you are investigating. You can of course also use this tool to study internal processes of a company to which jobs are arriving from an other internal process which is external to the studied processes.
- Outside arrivals follow a Poisson process.
- We model each queue in the network by an M/M/c model.
- A customer enters a facility independently of other customers and past behavior.
- Steady state analysis at equilibrium state of the system.
Most of the networks you will encounter in office and services fulfill these requirements!
Because the demand (the number of customers), the service time needed for a customer (or product, job, machine, etc.) and other parameters vary in real systems, the real time or dynamic modeling (simulation) of such systems is difficult and depend on a lot of assumptions you need to make while developing the model (the uncertainty of the results will depend on your assumptions). There is however another more simpler way of estimating the parameters of such systems by performing a steady state analysis at equilibrium state of the system. Such steady state analysis provides us the system parameters most of the time with acceptable accuracy.
Because the demand (the number of customers), the service time needed for a customer (or product, job, machine, etc.) and other parameters vary in real systems, the real time or dynamic modeling (simulation) of such systems is difficult and depend on a lot of assumptions you need to make while developing the model (the uncertainty of the results will depend on your assumptions). There is however another more simpler way of estimating the parameters of such systems by performing a steady state analysis at equilibrium state of the system. Such steady state analysis provides us the system parameters most of the time with acceptable accuracy.
TIP: It is not possible to explain all aspects of this model and results here. Please read my book for further info!
How To Use
To start first select the time unit, enter the desired number of facilities (nodes) in the Sidebar, then click Generate Model. When the model is ready fill in the green input cells (do not change other cells!) or start the Facility Editor and draw/define the network. When you are satisfied with all of your input click 'Solve Model'. The results will be presented in the 'Calculation Results' table.
TIP: Before the Facility editor's data is saved into the Sheet a backup is made of the current data in a Sheet called BackupMMc.
The Generate Example button will generate an example model with example input data filled in. You just need to push the Solve Model button.
Input Parameters:
- c: the number of servers (or employees) in the facility.
- μ: the service rate per server e.g. [jobs/h] in the facility.
- λFi: is the known external arrival rate to service facility (i) e.g. [arrival/h].
- Transfer Probabilities: the known probability of going from service facility (j) to (i). A value between 0.0-1.0 (0%-100%).
- λi: is the equivalent arrival rate to service facility (i). This parameter is calculated for you!
TIP: There can be more than one facilities where customers are arriving from the external population!
TIP: You can model rework (e.g. because of some errors in the processing) by defining a transfer probability from Facility (i) to (i), on the diagonal of the transfer probability matrix!
Calculation Results:
- a: the utilization of each server [%].
- N: the number of customers (or orders) in processing and waiting.
- Q: the number of customers (or orders) waiting in the facility.
- T: the total time a customer (or order) spends in the facility e.g. [h] (service time + waiting time).
- W: the average total waiting time in the facility e.g. [h].
- asys: the whole facility utilization [%].
- P0: the probability that there are no customers in the facility [%].
- Pwait: the probability that a customers has to wait [%].
IMPORTANT: it is possible that the network you define is not stable (not feasible) and thus it can not be calculated! In this case try to modify your network according to the info you receive!
BUSINESS PROCESS IMPROVEMENT HANDBOOK FOR OFFICE & SERVICES
FOR EXPERTS & MANAGERS AN ADVANCED GUIDE

Facility/Activity Network Editor

The Toolbar
The first button on the toolbar adds a new Facility. The next 4 buttons pan the drawing in the four directions. The last two buttons zoom in/out.

Connecting Facilities (or Activities)
 Each Facility represented by a block with several objects on it:
- The orange rectangle at the top left corner is used to connect two Facilities. Click the orange rectangle with the left mouse button and drag a connector to an other Facility.
- In the top-middle is the title of the Facility which consists the first 9 characters of the Facility's unique ID.
- At the top-right you find an 'X' which can be used to delete a Facility.
- Below you can input the c, μ and λ of the Facility.
- You can drag the Facility block by clicking on the block where no object is present and holding the left mouse button.
- You can input the transfer probability between two Facilities in the input box on the connector.
- You can delete a connector by clicking on the connector or on the blue rectangle with the 'C' label or by dragging of the end point. On a touch device (tablet) you can drag off the connector's end point from the Facility or tap on the blue 'C' rectangle label in order to delete the connection!
Saving Your Network
You can save your network by clicking on the Save button. If you do not want to save your changes then push the Cancel button.
TIP: The model in the current Sheet is saved into a Sheet called BackupMMc as a backup. If you would accidentally loose your work you can find the former input parameters in BackupMMc!

Decision Modeling Tools
Specialist Allocation Model Generator & Solver
This tool generates and solves automatically a Specialist Allocation Model for the specified number of locations, taking into account the available number of specialists and the required number of specialists per location. In this specific model the total travel distance is minimized but you may optimize the model for other parameters as e.g. the travel time also. The structure of the model will not change, only the text in the spreadsheet!
In the below example, what we want is to minimize the maximum number of km’s traveled by the specialists between the hospitals. In order to achieve this we need to find the most effective combination of allocation depending on the placement of the specialists. Instead of specialists in hospitals you could of course also allocate technicians to broken office equipment, sales people or consultants to customers, etc.

This Tool also demonstrates the integration of MS Excel like functionality with a powerful cloud based computing engine. Depending on the number of locations you would have to do a lot of work to make and calculate the model but by using this tool you can build and solve your model in just some minutes!
How To Use
This tool will calculate the optimal number of specialists that you need to send from each given location to the other locations. To start first enter the desired number of locations then click Generate Model. When the model is ready fill in the green input cells (do not change other cells!). In the 'Distance From/To' table enter the distances between the locations. In the Available column enter the available number of specialist at each location. In the Required row enter the required number of specialists at each location. Click 'Solve Model'. The results are presented in the 'Specialists From/To' table.Please note that you can choose between the Google Solver and the Internal Solver in the Settings (top of the Sidebar). The Google Solver (linear optimization service) is preferred. In case the Google solver would slow down, e.g. because of a high load on the server, you may choose the Internal Solver. You may also calculate your model with both of the solvers in order to validate the results!
You can read in the accompanying book more on Decision Modeling for Business Process Improvement (BPI) and on other important BPI subjects together with several real world examples!
Known issues/bugs (will be corrected in the next version):
- No known problems at the moment.
References
BUSINESS PROCESS IMPROVEMENT HANDBOOK FOR OFFICE & SERVICES, FOR EXPERTS & MANAGERS AN ADVANCED GUIDE, Zoltan Somogyi, 2016, ISBN 9789090296203, More info here!
Mason, A.J., “OpenSolver – An Open Source Add-in to Solve Linear and Integer Progammes in Excel”, Operations Research Proceedings 2011, eds. Klatte, Diethard, Lüthi, Hans-Jakob, Schmedders, Karl, Springer Berlin Heidelberg pp 401-406, 2012, http://dx.doi.org/10.1007/978-3-642-29210-1_64, http://opensolver.org
Statistical Process Control
This tool will automatically analyze your process data taking the sub-grouping of the data also into account. It will calculate all important statistical properties, it will automatically generate control charts and it will also automatically indicate on the control charts the most important problems with your process.

How to use
- Collect your data according to a pre-defined plan.
- In case you have not sub-grouped your data, place the data in a column (one data point per row) of a Google Sheet and select all data cells. Push the Update button on the Sidebar and then push the Report button. A new sheet will be created automatically with several statistical analysis including the statistical properties of your data, several control charts, etc.
- In case you have sub-grouped your data, place the data in n columns (one row per subgroup, where 'n' is the size of the subgroups or with other words the number of data points in a subgroup) of a Google Sheet and select all data cells in all columns. Push the Update button on the Sidebar and then push the Report button. A new sheet will be created automatically with several statistical analysis including the statistical properties of your data, several controls charts, etc. The tool takes your subgroups automatically into account. The statistical properties of your data are calculated for all data points in all subgroups!
TIP: Read my book (see here under) with the explanation on data collection, on all of the statistical tools and on how to use them. The book also includes all of the mathematical formula's used in the tool.

Control chart
AI-TOOLKIT Professional for MS Windows also contains an extensive data analysis toolkit also including control charts! The AI-TOOLKIT is free for non-commercial use. You can download it without registration on the AI-TOOLKIT website.
References
BUSINESS PROCESS IMPROVEMENT HANDBOOK FOR OFFICE & SERVICES, FOR EXPERTS & MANAGERS AN ADVANCED GUIDE, Zoltan Somogyi, 2016, ISBN 9789090296203, More info here!
Decision AI
Read more about Artificial Intelligence in Business Process Improvement in the Knowledge section!
This simple (decision tree based) but useful tool is a machine learning decision making business process improvement tool which can be used (after training the AI) to quickly make decisions about many different often complex matters as e.g.
Decision AI is very easy to use, it hides the complex algorithm of AI machine learning and with just a few input parameters you can make great improvements to your decision making process and accuracy. People make often mistakes because of complex issues depending on many parameters. A well trained AI will not make a mistake because of complexity but only if it is not trained well enough by you!
 in Business Process Improvement")
[STEP 2] Collect the data and divide it into two parts. One part (the larger part) will be used to train the AI and the other part will be used to test the AI model. By testing the AI you are able to see how accurate the decisions are. In case the accuracy is not acceptable you need to collect more data or even introduce extra parameters.
[STEP 3] Enter the AI training data and the AI testing data into a Google Sheet with the following format:
You may change some advanced parameters in the Settings which influence the AI model building algorithm. These parameters are the splitting criteria, gain ratio and pruning level. These parameters are for advanced user only (who understand how a machine learning AI algorithm is working) and normally you do not need to change these settings.
Read more about Artificial Intelligence in Business Process Improvement in the Knowledge section!
This simple (decision tree based) but useful tool is a machine learning decision making business process improvement tool which can be used (after training the AI) to quickly make decisions about many different often complex matters as e.g.
- Which next process step the employee (or client, product, etc.) has to take,
- Decide if an action should be taken or not,
- Select an employee (or client, product, etc.) for a specific task (or action, marketing campaign, etc.),
- Root cause analyses,
- ...etc. the applications are endless.
AI-TOOLKIT Professional for MS Windows also contains an extensive data analysis toolkit also including control charts! The AI-TOOLKIT is free for non-commercial use. You can download it on the AI-TOOLKIT website.
Decision AI is very easy to use, it hides the complex algorithm of AI machine learning and with just a few input parameters you can make great improvements to your decision making process and accuracy. People make often mistakes because of complex issues depending on many parameters. A well trained AI will not make a mistake because of complexity but only if it is not trained well enough by you!
How to use
[STEP 1] Design the AI by deciding which data to collect. This step is crucial because the capabilities of the AI will depend on it. You need to collect (e.g. by measurements, interviews, etc.) all relevant parameters which are necessary to describe the specific problem you want the AI to learn. E.g. in a hospital if you would want the Decision AI to help you to decide which specific next step the patient needs to take (go home, intensive care, general care, etc.), then you would collect all data about many patients which are necessary to make this decision (patient's temperature, blood pressure, perceived comfort, etc.). By feeding all these data to the Decision AI together with the right decisions you can train the AI and use it later to help you make the right decision fast. Very complex issues can be decided in this way very quickly with great confidence. The accuracy of the decisions will depend on how good you train the AI.
[STEP 2] Collect the data and divide it into two parts. One part (the larger part) will be used to train the AI and the other part will be used to test the AI model. By testing the AI you are able to see how accurate the decisions are. In case the accuracy is not acceptable you need to collect more data or even introduce extra parameters.
[STEP 3] Enter the AI training data and the AI testing data into a Google Sheet with the following format:
TIP: Look at the built in Example in order to understand quickly the necessary format!
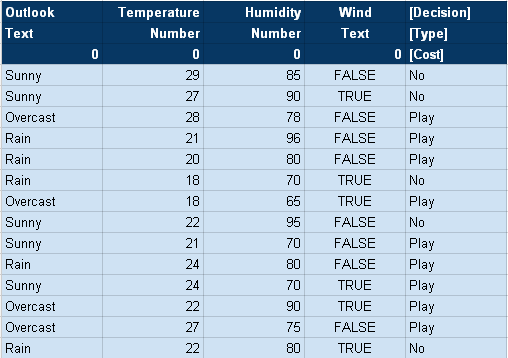
- 1 header row with the parameter (attribute or feature) names in separate cells and one cell with the text ‘[Decision]’, which designates the column with the decision values.
- 1 optional header row defining the type of the parameters: ‘Text’ or ‘Number’ and with the text ‘[Type]’ in the ‘[Decision]’ column. If you do not define this header row all parameters will be treated as Text!
- 1 optional header row defining the cost of each parameter and with the text ‘[Cost]’ in the ‘[Decision]’ column. The cost can be e.g. the time needed to perform the 'feature process' the parameter belongs to, the cost of making the measurement to get the parameter data (e.g. because of the used equipment), the cost of equipment, the cost of the man hours of a specialist, etc. The unit is not important, it can be any time unit, or any length unit, or any kind of money unit, .... BUT all of the parameters (features) need to have the same unit and need all be defined or all not defined! When defined the algorithm will take the cost of each feature into account and will optimize the AI model for the cheapest solution.
- Several rows of data. Depending on the type defined in the header, Text or Number.
Example Training data:
AI training data to decide whether to play golf or not depending on weather conditions:
The test data must include the [Decision] and also the [Type] header rows (because they are defined in the training data) but the [Cost] header row is optional here (may or may not be included) because the cost is already taken into account while building the AI model.
[STEP 4] Select the training data range and push the Update button next to the training data range field. The Sheet range will be added to the input field. Do the same with the test data range.
[STEP 5] Push the Train AI button. The AI model is built at this step.
REMARK: In this version of the Add-on the model training time is limited to max 6 minutes! This should be enough for processing several thousands of data. In case you are interested in an unlimited version then please contact me.
When the AI is ready with training/building the model a new screen will appear with a tree representation of the model. The AI builds this decision tree model as a kind of thinking map in order to be able to quickly find the appropriate decision by traversing this tree depending on the input parameters.
After the model is built it is saved in the Decision AI Tool internally. Each sheet can have one saved model. You can view the tree representation of the saved model any time by pushing the View button.
You can also download the AI model by pushing the Download button. The file format is the so called json format and you can view it with one of the many free json file viewers on the internet or with a simple text editor. The advantage of using a json viewer is that the data then viewed in a structured way.
 in Business Process Improvement")
 in Business Process Improvement")
[STEP 6] Navigate to the ‘ASK AI’ tab in order to use your trained AI to make quickly and accurately a decision depending on several input parameters. The accuracy of the decision made by the AI will depend on how good you have trained the AI.
The input data format must be the same as the training data format. You must include the first header row (with the [Decision] header cell) and the second [Type] header row in case it was present in the training set, which both must be the same (name and sequence) as with the training data! The [Cost] header row is optional/not necessary. After the header row(s) you can input 1 or several data rows for 1 or several decisions.
Select the input data range (header rows + data) and push the Update button next to the Select input data range field. The Sheet range will be added to the input field. Then, push the Analyze & Decide button. The decisions will be filled in automatically in the [Decision] column.
Settings
Edit Tree Colors:
- You can modify here the colors used in the AI model tree view.
Advanced Settings:
- Splitting Criteria:
You have here two choices, the Entropy which is used by the so called C45, C50, etc. machine learning algorithms, and the Gini which is used by the so called CART machine learning algorithms. Normally you do not need to change this setting. The Entropy and Gini favor attributes that have a large number of discrete values while splitting the data, in case this provides a problem (lower model accuracy) the Gain Ratio should be used. - Use Gain Ratio:
If you choose Yes the gain ratio (Entropy or Gini) will be used instead of the Gain in the splitting criteria calculations. Normally you do not need to change this setting. In some rare specific cases the gain ratio will give more accurate results. - Pruning Level:
Pruning means that the model is being optimized by eliminating unneeded nodes. Pruning begins from the bottom of the AI tree model and it prunes/optimizes the chosen number of levels. If you choose ‘Auto’ the necessary pruning level will be calculated automatically. If you choose 0 the model will not be optimized/pruned/modified. - Print Scale: The AI model tree view (View) can be scaled to the appropriate zoom level by using the toolbar buttons. This can be interesting e.g. when printing the tree. In some cases you may need extra scaling down of the printed image of the tree in order to fit more tree nodes on the selected page size. With this setting you can force the scaling down of the image and by this more items will fit the paper.
The AI Model Tree Viewer
The AI model tree representation can be viewed on this screen. Use the toolbar buttons to move or zoom in/out the tree. You can also print the tree with the print button. If your computer supports printing to PDF then you can also save the tree image in a high resolution PDF document (there are many free PDF print components for all computer platforms). Please note that in case of a very large model you may have to zoom in on a specific part of the tree and print only a subset of the model. You can of course repeat the procedure on an other part of the model and like this print the whole model step by step!
Some of the nodes on the tree model can be collapsed (-) or expanded (+).
AI-TOOLKIT Professional for MS Windows contains also an extensive data analysis toolkit also including control charts! The AI-TOOLKIT is free for non-commercial use. You can download it without registration on the AI-TOOLKIT website.
Read more about Artificial Intelligence in Business Process Improvement in the Knowledge section!